| Wählen Sie die deutsche Sprache |
| Wählen Sie die deutsche Sprache |
How does the map construction of Arno Peters work ?
1. The shape of the earth
2. The division of the earth's surface
3. A special feature of the circle of latitude
4. Just a short review of mathematics
5. The vision of Arno Peters
6. Maps made by projections
7. The grid mesh system
8. Insert coordinates on the map
9. The decimal map
Preface
In the documents that I have the map construction of Arno Peters is
described. But unfortunately, as often in special literature, very hard to understand for
someone not involved with the subject.
I tried to review some basics and describe the steps of the map construction in a way
that hopefully most people can understand.
The shape of the earth
With the realization of the fact that the earth is not a disk but must be of the shape of a sphere, a significant change in the view of the world took place.
 |
 |
If you cut through the center of a sphere, the cut's surface will always be a circle. A circle is a geometric figure which is easy to handle with the circle constant p = 4*arctan(1) = 3,14... .
But unfortunately the earth is not a sphere. If you cut the earth through the center, the cut's surface will be an ellipse. This is an annoying fact, because an ellipse is much more difficult to handle. Compared to a circle an ellipse has two radius. The major semi-axis a and the minor semi-axis b.
The earth is rotation relatively regular around the polaxis. During one day any point
on the earth's surface runs on a circular orbit around the polaxis. So if you cut the
earth along the equator through the center the cut's surface will be a circle. That means
that the shape of the earth is - even very slightly - a flattened rotating ellipsoid,
called spheroid.
In the past centuries almost unlimited so called "Reference Spheroids" have
been surveyed. The flattening f is expressed through the following formula:
f = (a - b ) / a
"e" expresses the value of the deviation of an ellipse from a circle and is called "numeric eccentricity". The smaller e the more circular is the ellipse.
![]()
Reference Spheroid |
major semi-axis a (m) |
minor semi-axis b (m) |
Flattening f |
1 / f |
e |
Airy 1830 |
6377563,396 |
6356256,909 |
0,003340850641 |
299,324964600 |
0,0816733739 |
Modified Airy |
6377340,189 |
6356034,448 |
0,003340850641 |
299,324964600 |
0,0816733739 |
Australian National |
6378160,000 |
6356774,719 |
0,003352891869 |
298,250000000 |
0,0818201800 |
Bessel 1841 (Namibia) |
6377483,865 |
6356165,383 |
0,003342773182 |
299,152812800 |
0,0816968312 |
Bessel 1841 |
6377397,155 |
6356078,963 |
0,003342773182 |
299,152812800 |
0,0816968312 |
Clarke 1866 |
6378206,400 |
6356583,800 |
0,003390075304 |
294,978698200 |
0,0822718542 |
Clarke 1880 |
6378249,145 |
6356514,870 |
0,003407561379 |
293,465000000 |
0,0824834000 |
Everest (India 1830) |
6377276,345 |
6356075,413 |
0,003324449297 |
300,801700000 |
0,0814729810 |
Everest (Sabah Sarawak) |
6377298,556 |
6356097,550 |
0,003324449297 |
300,801700000 |
0,0814729810 |
Everest (India 1956) |
6377301,243 |
6356100,228 |
0,003324449297 |
300,801700000 |
0,0814729810 |
Everest (Malaysia 1969) |
6377295,664 |
6356094,668 |
0,003324449297 |
300,801700000 |
0,0814729810 |
Everest (Malay, & Sing) |
6377304,063 |
6356103,039 |
0,003324449297 |
300,801700000 |
0,0814729810 |
Everest (Pakistan) |
6377309,613 |
6356108,571 |
0,003324449297 |
300,801700000 |
0,0814729810 |
Modified Fischer 1960 |
6378155,000 |
6356773,320 |
0,003352329869 |
298,300000000 |
0,0818133340 |
Helmert 1906 |
6378200,000 |
6356818,170 |
0,003352329869 |
298,300000000 |
0,0818133340 |
Hough 1960 |
6378270,000 |
6356794,343 |
0,003367003367 |
297,000000000 |
0,0819918900 |
Indonesian 1974 |
6378160,000 |
6356774,504 |
0,003352925595 |
298,247000000 |
0,0818205908 |
Hayford (International) 1924 |
6378388,000 |
6356911,946 |
0,003367003367 |
297,000000000 |
0,0819918900 |
Krassovsky 1940 |
6378245,000 |
6356863,019 |
0,003352329869 |
298,300000000 |
0,0818133340 |
GRS 80 |
6378137,000 |
6356752,314 |
0,003352810681 |
298,257222101 |
0,0818191910 |
South American 1969 |
6378160,000 |
6356774,719 |
0,003352891869 |
298,250000000 |
0,0818201800 |
WGS 72 |
6378135,000 |
6356750,520 |
0,003352779454 |
298,260000000 |
0,0818188107 |
WGS 84 |
6378137,000 |
6356752,314 |
0,003352810665 |
298,257223563 |
0,0818191908 |
The International Civil Aviation Organization (ICAO) prescribed the Reference Spheroid WGS84 in 1998 for all geographical coordinates related to aviation.
All following calculations refer to the Reference Spheroid WGS84.
The division of the earth' surface
Considering the earth to be a sphere it made sense to divide the two
circles which are rectangular to each other into angles. So the equator has 360° and the
cut through the poles as well. But where to begin counting. Anyway, one has agreed
someday.
The Englishmen asserted themselves, they defined arbitrarily the meridian, that ran
through their observatory of Greenwich, as 0°. From here it is counted 180° to both
sides eastward and westward. The longitude 180° is also known as date line. Longitudes
are marked with the Greek letter of l
(lambda).
The reference-latitude 0° is pretended physically from the equator. From the equator
it is counted 90° to both sides northward and southward. The Greek letter for the
geographical latitude is j (phi).
Circles of latitude |
|
 |
 |
Circles of longitude |
|
 |
 |
A special feature of the circle of latitude
The geographical latitude of j (phi) declares about which angle the local horizon of a location on the earth's surface is inclined against the earth's horizontal axis.
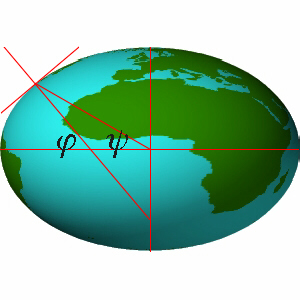
The horizon touches the surface of the ellipse as tangent. The zenith
cuts the horizon perpendicular. This line does not cut through the center of the earth.
The angle between the horizontal axis of the earth and the line from the center of
the earth to the intersection of the zenith with the horizon is called geocentrical
latitude and is marked with the Greek letter y (psi). The angle
of the geocentrical latitude is always smaller than the corresponding geographical
latitude. The geocentrical latitude is expressed with the following formula:
![]()
The difference between the geocentrical and the geographical latitude decrease to the poles and to the equator an reaches the value 0. The following diagram illustrates this and shows the largest deviation at 45° geographical latitude.
WGS84 Spheroid |
|
Just a short review of mathematics
Circle: U = circumference, r = radius |
Ellipse: U = circumference, a =
major semi-axis, |
U = 2pr |
U is the limit value of the row with e < 1 |
| Equator = 40075,0166855785 km | Ellipse (circle) of longitude = 40007,8629172458 km |
Here only a short hint for the calculation of geometry bodies: There
are different names for the surfaces or parts of the surface of geometry bodies.
The area of a cylinder and the area of a cones normally include the area of the
top and/or bottom disk(s). The unwrapping area M does only consist of the unrolled area of
a cylinder or a cone.
The area of a spherezone does not include the areas of the top and
bottom disks.
The area of a spheroidzone does not include the area of the top and
bottom disks.
Cylinder: M = wrapping area, h = height, r = radius of circle |
M = 2prh |
Spherezone: M = wrapping area, h = height, r = radius of sphere |
M = 2prh |
Spheroidzone: Z = wrapping area, b = minor semi-axis, a = major semi-axis, y = geocentrical latitude |
|
According to my opinion, the vision of Arno Peters is based, on an
especially distinctive equality-thought and truth-feeling.
It is true; historical events have taken place at different geographical places at the
same time. Therefore, each historical event has the right on an individual place on an
uniform time-scale. Arno Peters illustrated this in his " Synchronoptical
World-history" impressively.
All countries, that have a territory, possess also a geographical area. Who wanted to
claim nowadays to pass a judgment on the valence of countries? All countries of the world
have the same right to be portrayed on a global map in accordance with fidelity of area.
Arno Peters has succeeded this representation with the construction of his global map.
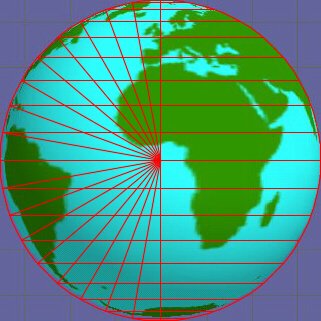
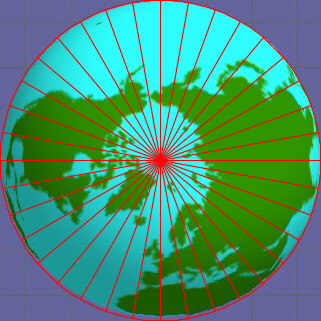
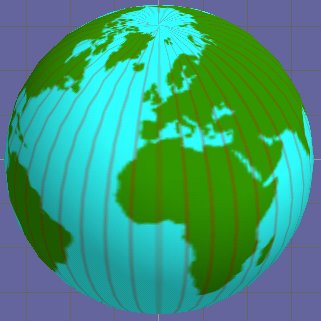
Someday it was recognized that it is not possible to unwind the
surface of a sphere in order to be able to represent it two-dimensional. Therefore a
procedure was developed to transfer the surface of a sphere on to a geometrical system
that can easily be unwind. The magic-word of the cartography is called
"projection".
It is considered that the water on the earth's surface is transparent. Now a lamp
will be illuminated in the center of the earth. A transparent geometrical body is put over
the earth and all to do is, to outline the shadows that the landmasses cast. After
unwrapping the surface of the geometrical body the result is a map on a two-dimensional
surface. Simply brilliant.
![]()
|
 |
|
|
The question, that poses itself, is: Can a map be produced exclusively through a projection? The answer is: No! Arno Peters has developed a system, with which a map can be produced by purely mathematical calculations. Therefore, the type of map-production of Arno Peters is not called projection but "construction". In order to understand the Peters-construction, one must oust the thoughts of any type of projection of the surface of the world and must turn to the mathematical construction completely.
In the following the system is described how the global map is produced using the Peters-construction method.
Definition of terms |
||
 Spheroidzone |
 Zonestripe |
 Zonesegment |
A part of the surface of an spheroid between the equator and any circle of latitude. |
A part of the surface of an spheroid between
two predefined circles of latitude. |
A specific part of the Zonestripe |
For demonstration the circles of latitude are drawn in steps of 10 ° and the circles of longitude are drawn in steps of 20°. |
||
A grid mesh is a rectangular area from which a grid is constructed.
Starting point for our global map is a horizontal line with a length
of the desired width of our global map. Let's consider our map should be 3,60 m (= 360 cm)
wide. This line represents the equator. Because there are twice a many circles of
longitude than circles of latitude a zonesegment is twice as wide than high. Every
zonesegment is l = 2° wide and j =
1° high.
The width of our basic grid mesh is 360 cm / 180 = 2 cm wide. Because the basic grid
mesh is a square the height is also 2 cm.
First we determine the geocentrical latitude of the geographical latitude j = 1° and the result for y = 0,993306966°. Then we put all values in to the
formula and determine the area of the spheroidzone = 4431047,0014894
km².
Now we divide this area by 180 and the result is the area of the zonesegment 4431047,001489400 / 180 = 24616,927786052 km².
To get a square we draw the square root of this area and we have the basic grid mesh
height Ö24616,927786052
km² = 156,897825944 km. This height is called baseline and will be used
to determine all heights of all following grid meshes.
On our global map this value equals the ratio 2 cm / 156,897825944 km = 0,012747149.
Because of the conversion to a square a distortion in form is the result.
Estuary of the Amazonas j = 0°N to 1°N, l = 51°W to 49°W |
|
Zonensegment |
 Basic grid mesh |
All grid meshes within the grid have the same width (baseline).
All grid meshes between two circles of latitude have the same height.
To get the height of the next grid mesh we first have to determine
for j = 2° equals y =
1,986622004°. The area of the spheroidzone is 8860780,38317385 km². To get the area of
the zonestripe between j = 1° to 2° we have to subtract the
area of the preceding spheroidzone from the actual spheroidzone 8860780,38317385 km² -
4431047,0014894 km² = 4429733,38168445 km². The area of the zonesegment is
4429733,38168445 / 180 = 24609,629898247 km²: The height of this zonesegment equals the
ration between the area of the zonesegment and the baseline 24609,629898247 km² /
156,897825944 km = 156,851312312 km.
On our map this value equals 156,851312312 * 0,012747149 = 1,999407084 cm.
The height of a grid mesh equals the ratio between the area of the zonesegment and the baseline.
All following grid meshes are calculated with the same scheme.
E arth's surface |
Our global map |
||||||
j |
y |
Spheroidzone | Zonestripe | Zonesegment | Height | Height | Cumulated Height |
| (°) | (°) | Z (km²) | Zx - Zx-1 (km²) | A = Zx / 180 (km²) | h (km) | h (cm) | hcum (cm) |
1 |
0,993307 |
4431047,001489 |
4431047,001489 |
24616,927786 |
156,897826 |
2,000000 |
2,000000 |
... |
|||||||
10 |
9,934394 |
44093962,579799 |
4372034,074873 |
24289,078194 |
154,808252 |
1,973364 |
19,902277 |
20 |
19,876630 |
86881830,441838 |
4183281,499747 |
23240,452776 |
148,124760 |
1,888168 |
39,215034 |
30 |
29,833636 |
127088269,973908 |
3869280,153550 |
21496,000853 |
137,006365 |
1,746441 |
57,362637 |
40 |
39,810611 |
163500855,294729 |
3437827,233588 |
19099,040187 |
121,729158 |
1,551700 |
73,797843 |
50 |
49,810390 |
195004372,156136 |
2900248,357196 |
16112,490873 |
102,694163 |
1,309058 |
88,017289 |
60 |
59,833076 |
220616960,330178 |
2271530,040678 |
12619,611337 |
80,432034 |
1,025279 |
99,577802 |
70 |
69,875993 |
239526470,178184 |
1570231,881968 |
8723,510455 |
55,599945 |
0,708741 |
108,112809 |
80 |
79,933979 |
251124238,080918 |
818078,072684 |
4544,878182 |
28,967120 |
0,369248 |
113,347585 |
90 |
90,000000 |
255032810,842458 |
39192,005387 |
217,733363 |
1,387740 |
0,017690 |
115,111761 |
This is just an extract of the complete table |
|||||||
 |
|||||||
All 16200 calculated grid meshes (including the 180 basic grid
meshes) are now mirrored horizontally around the equator. so we get the grid for the
southern hemisphere.
Remark: The grid has to be mirrored because the valid range for the formula to
calculate the area of the spheroidzones goes from y =
0° to y = 90° only.
The total height of our global map is htot = 2 * hNorth =
2 * 115,11176061 cm = 230,223521219 cm. The ratio between width and height equals 360 cm /
230,223521219 cm = 1 : 1,563697741.
For the contemplation of the precision, two aspects are imperative. To the one the user of the map, who expects, that the surface of the earth is represented, as shown on the map. A pilot compares the surface of the earth below him with the map and determines his position. Depending on the use of a map the scale of the map will vary. Therefore, the surveyor who surveys a property will uses a map with a larger scale than the climate-researcher, who presents a report on the global warming of the seas.
On the other side are the cartographers, whose task is it to draw geographical data of the world on a two-dimensional map. For the drawing of coordinates predefined lines are required.
Since the width of the Peters global map can be chosen arbitrarily,
all longitudes behave to each other linearly. The reference-line for the drawing of
longitudinal-coordinates is any circle of longitude. No problem.
The reference-line for the drawing of latitudinal-coordinates is the equator. The height
of the grid meshes decreases toward the poles. Latitudinal-coordinates do not
behave linearly within even one grid mesh.
In order to draw any latitudinal-coordinate, the ration of the area of the spheroidzone,
from which the basic grid mesh was developed, to the baseline must be known first.
Area of the spheroidzone / baseline = 4431047,0014894 km² / 156,897825944 km =
28241,608669977 km.
If for example the geographical latitude 30° needs to be drawn, the geocentrical latitude
is calculated first. With this value the area of the spheroidzone is determined. Then,
this area 127088269,973908 km² is divided by 28241,608669977 km divides = 4500,036504968
km.
This value corresponds to on our map 4500,036504968 km * 0,012747149 = 57,362635834 cm.
This result can also be achieved by adding the heights of all 30 grid meshes. However
problems will occur using this method when decimal numbers need to be drawn (e.g. 37,839°
N). For any 1/10 degree precision the number of grid meshes that need to be calculated
will increase by 10.
Simultaneously with the introduction of the mathematical principles of constructing his global map Arno Peters established a decimal grid. He relocated the reference longitude 0° to a position between the continents Russia and America arbitrarily. His new longitude 0° runs almost exclusively over water. From there he counts 100 circle of longitude to the right (east). The reference line for the circle of latitudes is the north pole. From there he counts 100 circles of latitude downwards to the south pole. For expressing any geographical coordinate the terms northern and southern latitude or easterly and westerly longitude is not required anymore.
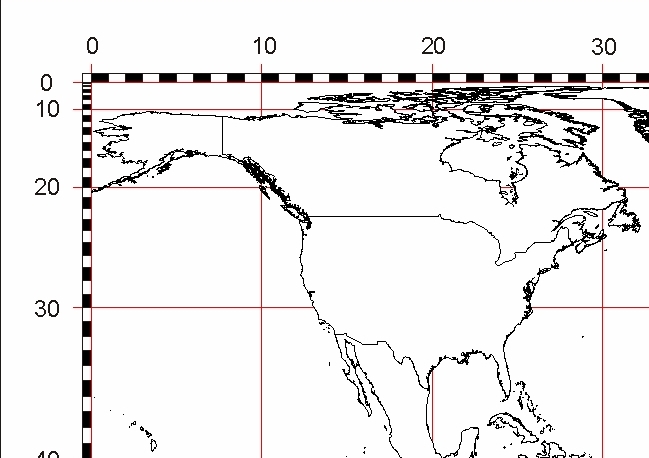 On the Peters-map the Longitude 0 runs through the Behring-Sea. |
The conventional longitude 0° runs through the very easterly part of Russia. |
New York has the geographical coordinates » 41° northerly latitude 74° westerly longitude. |
If one intended to establish the decimal grid for the use on maps all geographical data would need to be recalculated worldwide. A hopeless venture.
The conventional 360° grid is based on a long historical development by the observation of the sun and the stars. This has influenced our calendar (365 days for one orbit around sun), as well as also our understanding of the time (24 hours for one rotation around the poleaxis). Should the decimal grid be established our calendar and the definition of time has to be adapted inevitably. In present days this seems to be impossible to me.
In his atlas Arno Peters used the conventional 360° grid. Only in the rear book-cover his global map with the decimal grid is found. Also on his global map "All countries of the world projected with fidelity of area" the conventional grid is used. Only on the maps edges, the division according to his decimal system can be found.
Please report all broken LINKS, thank you.
This is a private homepage with absolutely no commercial intentions.
Copyright © Jürgen Heyn 2001, All rights reserved
Date of last amendment: 01. Dezember 2011